
Statistical tests + Dynamic Programming = ?
Recently I encountered an interesting research question – a binary outcome (e.g. diabetes) is known to be associated with a continuous risk factor (e.g. body mass index (BMI)), how can we partition the continuous variable into consecutive non-overlapping intervals such that the likelihoods of the outcome occurring are similar within an interval but significantly different between two adjacent intervals (e.g. risks of diabetes are significantly different when BMI is in intervals [a, b], [b, c] and [c, d])? One may suggest to use the classic logistic regression. Though the curve of the predicted probability against the independent variable can give us some insights on which areas the partition points are likely to reside, the guesswork lacks statistical-based evidence. It turns out that there is a really fascinating solution to such questions – flexible isotonic regression model1.
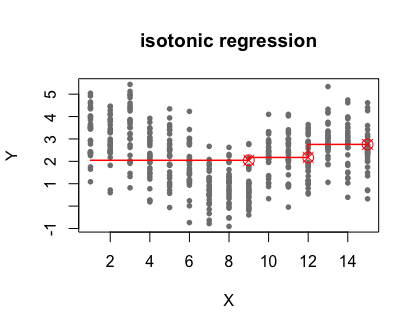
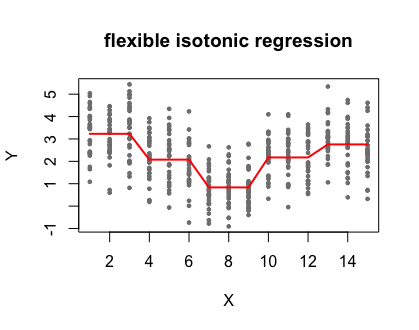
You may have heard of the isotonic regression, a model that fits the optimal monotonic step function to the relation between the independent variable (X) and the dependent variable (Y). However, it’s not suitable to the present research question because (1) it has monotonic constrains while the relation between X and Y can be U-shape or other non-monotonic trend, and (2) isotonic regression usually generates overwhelmingly more partition points which requires extra efforts to reduce them. The flexible isotonic regression overcomes the previous two drawbacks, and it employs the clever combination of statistical tests and dynamic programming. The main focus of this post is to decipher and analyze the algorithm2 of the flexible isotonic model.
💧 Mathematical notations
Let’s first use some mathematical notations to clarify the question that we are tackling. Consider a data with two variables: $$X = \{ \underbrace{x_1}_{x_{11},…,x_{1n_1}} < \underbrace{x_2}_{x_{21},…,x_{2n_2}} < … < \underbrace{x_m}_{x_{m1},…,x_{mn_m}}\}$$
$$Y = \{y_{kl}; k=1,…,m; l = 1,…,n_k\} $$ where $X$ is arranged in increasing order and assigned into $m$ groups/intervals and each group has $n_k (k=1,…,m)$ observations, $Y$ is also reordered accordingly. The question is how to partition the $m$ intervals of $X$ into consecutive non-overlapping intervals such that the means/proportions of $Y$ are similar within an interval but significantly different between two adjacent intervals?
💧 Objective function
No matter which model is performed, the solution is always trying to optimize an objective function. In this case, the objective function is the maximum likelihood function. If $Y$ is assumed to follow normal distributions (with a common covariance), then the maximum likelihood estimation is equivalent to the estimations by minimizing the sum of squared errors (SSE). The SSE calculation of observations in the block of $\{x_i,…,x_j\}$ is
$$ s(i,…,j) = \sum_{k=i}^j\sum_{l=1}^{n_k}(y_{kl}-\bar{y}_{i,…,j})^2$$
where $\bar{y}_{i,…,j}$ is the sample mean in the block. If $Y$ follows binomial distribution, then it’s equivalent to minimize the negative log-likelihood function
$$ s(i,…,j) = -\ln\prod_{k=i}^j\prod_{l=1}^{n_k}\bar{y}_{i,…,j} ^{y_{kl}} (1-\bar{y}_{i,…,j})^{(1-{y_{kl}})} $$
💧 Overlapping subproblems
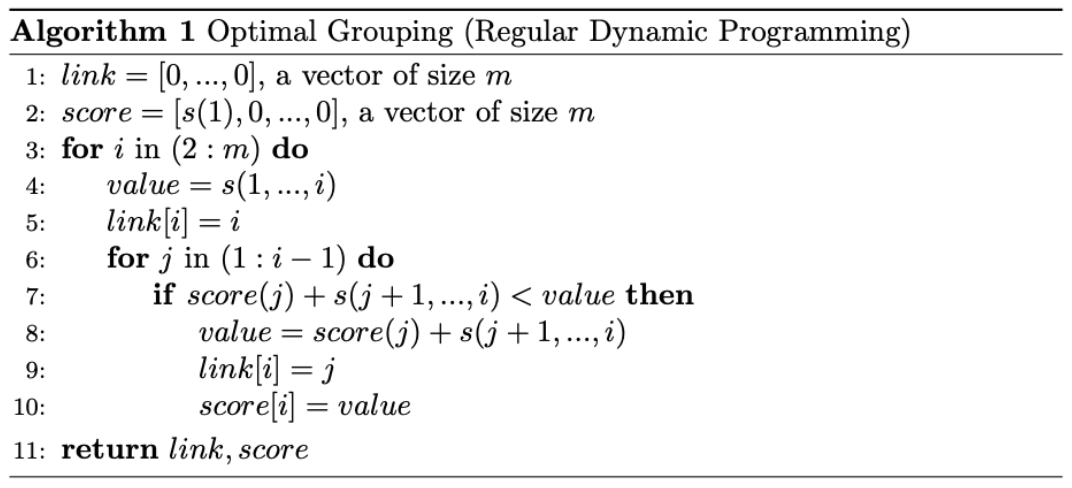
The key of the dynamic programming being considered here is that solving the subproblem relies on solving smaller subproblems. i.e., the optimal partition of $\{x_1,…,x_m\}$ depends on the optimal partition of the smaller block $\{x_1,…,x_k\}(k<m)$. For now, if we ignore the restriction that means/proportions of $Y$ have to be similar within an interval and significantly different between two adjacent intervals, instead, we only ask the optimal partition to give the maximum likelihood value, then the regular dynamic programing as shown in algorithm 1 solves the problem perfectly. In algorithm 1, $link [k] (k=1,…,m)$ indicates the optimal partition point for block $\{x_1,…,x_k\}$, and we can use the $link$ vector to retrieve the optimal partition. $score[k]$ gives the corresponding optimal objective function value of partitioning $\{x_1,…,x_k\}$.
💧 Modified dynamic programming
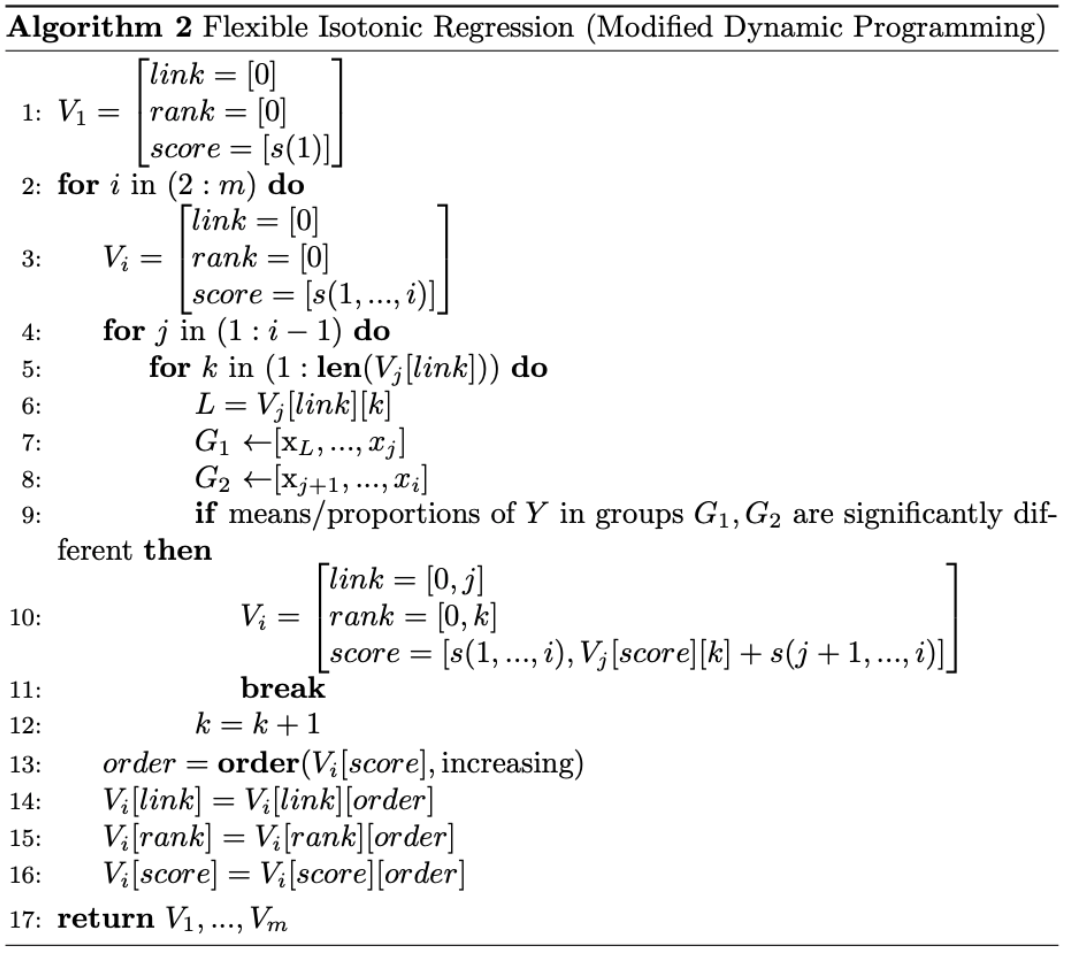
However, when take into account the condition that means/proportions of $Y$ are similar within an interval and significantly different between two adjacent intervals, we need to modify the dynamic programming to accommodate the requirement. Compared to algorithm 1, algorithm 2 is different in two places:
Take the partition of $\{x_1,…,x_i\}$ as an example,
-
In line 4-12. When deciding if $x_j(j<i)$ is a partition point of block $\{x_1,…,x_i\}$, we need to consider not only the optimal partition point but all the partition points of the subproblem $\{x_1,…,x_j\}$. Suppose $x_k(k\leq j)$ is a such partition point, if the means/proportions of $Y$ in blocks $\{x_k,…,x_j\}$ and $\{x_{j+1},…,x_i\}$ are significantly different, $x_j$ is a partition point for $\{x_1,…,x_i\}$. Otherwise, we try the next partition point $x_{k’}$ of $\{x_1,…,x_j\}$ and check if the means/proportions of $Y$ in blocks $\{x_{k’},…,x_j\}$ and $\{x_{j+1},…,x_i\}$ are significantly different. Loop through the partition points of $\{x_1,…,x_j\}$ until we identity a $x_k$ that meets the condition. If no such partition point exits, $x_j$ is not a partition point of $\{x_1,…,x_i\}$.
-
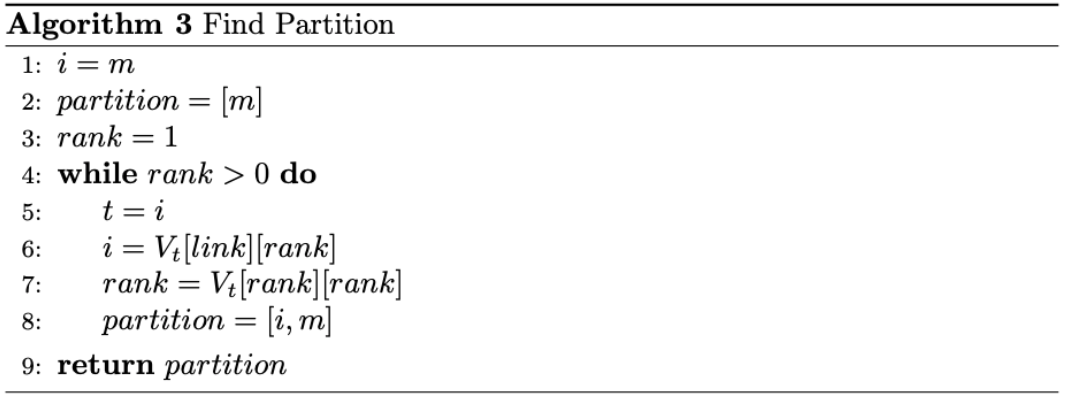
In line 1-3. For each $i(i=1,…,m)$, we use $V_i$, a list of lists, to keep in record all partition points and values that satisfy the condition. The list $V_i[link] = [j_1,…,j_k,…,j_i]$ denotes all the partition points of $\{x_1,…,x_i\}$, list $V_i[rank] = [r_{j_1},…,r_{j_k}…,r_{j_i}]$ records the index of the partition point being considered in the sequence of partition points for the subproblem of $\{x_1,…,x_{j_k}\}$, list $V_i[score] = [s_{j_1},…,s_{j_k}…,s_{j_i}]$ gives the corresponding objective values. The values of each inner list are arranged by the increasing order of the values in the $score$ list (line 13-16), therefore, for the block $\{x_1,…,x_i\}$, the optimal value is the first element in list $V_i[score]$. Furthermore, as shown in algorithm 3, we can use the lists $V_1,…,V_i$ to retrieve the optimal partition of $\{x_1,…,x_i\}$.
💧 Statistical tests
Up to this point we haven’t touched anything on the statistical tests yet, but you may have already guessed where in the algorithm that we need to employ the testing. In algorithm 2 line 9, we need to check if the means/proportions of the outcome $Y$ in two adjacent groups are significantly different, which reduces to simple two-sample mean/proportion test questions.
-
If $Y$ follows normal distributions (with common covariance), use two-sample t-test.
-
If $Y$ follows binomial distributions, use chi-square test or Fisher exact test depending on if any of the expected counts in the $2\times 2$ table is less than 5.
💧 Remark
I really like the idea of combining the statistical testing and dynamic programming applied in the flexible isotonic model. It’s a perfect example of assembling the simple tools in a clever way can solve complex questions.
R codes are available for the flexible isotonic model to be used for continuous outcome2, binary outcome3 and survival data4.