
What emotion makes politician's tweets get more engagement?
This post is based on my report to a 3-day datathon event (placed the 1st), code and data are available at Github repo here. The conclusion needs to be further examined and should be taken with caution.
1. Abstract
The social media has become an indispensable part in human’s life, which has served as a major platform for knowledge & news sharing and makes it possible for people around the world get connected. Among all the social media platforms, Twitter has been a critical tool for politicians to advocate their policies. Therefore, a natural question to ask is how politicians can make Twitter users to engage with their tweets so that they can amply their influence and facilitate the proceedings of their policies and campaigns. In this report, given the tweets posted by the US senators and representatives in the month January 2021, I will investigate how the emotions expressed in the tweets, such as anger, joy, sadness etc., are affecting people’s engagements with the politicians’ tweets, both quantitatively and qualitatively. The final data set used for the analysis has 19 variables and 39396 observations/tweets. The outcome variable is binary and it identifies whether or not a tweet has active engagement with people. The independent predictors are composed of two parts: user-specific predictors and tweet-specific predictors. A set of logistic models are fitted to investigate the contributions of different emotions to the probability of people engaging with the tweet. The result shows that, among all the analyzed emotions (anger, joy, sadness, anticipation, trust, surprise and disgust), “anger” contributes more to the tweets engagement then other emotions, “joy” makes the second largest contribution. In addition, the contribution from “anger” and “joy” to the tweets engagement varies dependent on which party the politician belongs to. Democratic and republican politicians are more divided in their tweets content when the tweets express anger emotions, while they are less divided when the tweets content express joy emotions.
2. Exploratory data analysis
2.1 Research question
In the report, I will investigate how different emotions (anger, joy, sadness, anticipation, trust, surprise and disgust) expressed in the tweet affect people’s engagements with it.
2.2 Train data
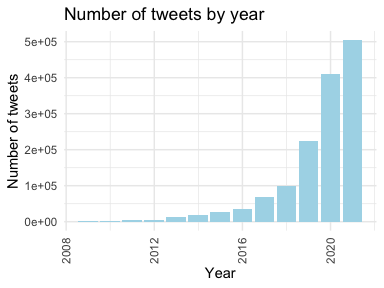
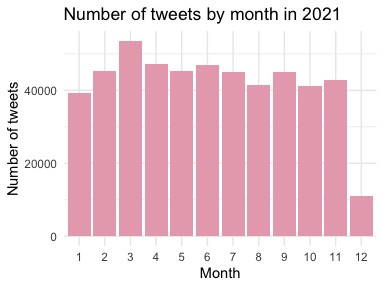
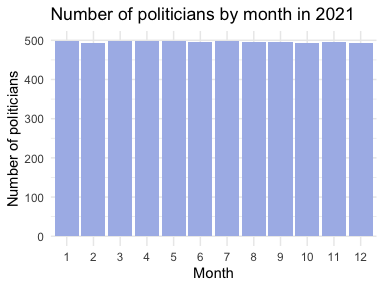
The full data set contains tweets posted by the US senators and representatives from 2008 to 2021 of different languages. In this report, only tweets in English are investigated. From the three bar plots, it can be observed that the number of posted tweets is increasing by year. In year 2021, the number of posted tweets in each month is pretty much the same around 40000, except in December due to that data collection ends early in December 2021. The number of unique Twitter users who have posted at least one tweet in each month is approximately the same around 500. Therefore, from the perspective of tweets volume and user participation, the data looks homogeneous across different months in 2021. Due to the time and computation limits, I will use tweets collected in Jan. 2021 for this report.
2.3 Preliminary variable selection
Twitter API provides 90 features for each tweet. After checking the
missingness and meaning of each feature, features that have majority
missing values, like quote_count, are removed; Features that have
repeated meanings, like reply_to_user_id and reply_to_screen_name,
are removed; Features that have singular values, like media_type, are
removed; Features that are irrelevant to the research questions, like
source, are removed. Only 37 features are retained, and their names
are listed below.
##  [1] "favorite_count"          "retweet_count"           "followers_count"
##  [4] "statuses_count"          "reply_to_status_id"      "is_quote"
##  [7] "is_retweet"              "user_id"                 "screen_name"
## [10] "friends_count"           "listed_count"            "favourites_count"
## [13] "status_id"               "created_at"              "text"
## [16] "hashtags"                "urls_url"                "media_url"
## [19] "mentions_user_id"        "quoted_status_id"        "quoted_screen_name"
## [22] "quoted_text"             "quoted_created_at"       "quoted_favorite_count"
## [25] "quoted_retweet_count"    "quoted_followers_count"  "quoted_friends_count"
## [28] "quoted_statuses_count"   "retweet_status_id"       "retweet_screen_name"
## [31] "retweet_text"            "retweet_created_at"      "retweet_favorite_count"
## [34] "retweet_retweet_count"   "retweet_followers_count" "retweet_friends_count"
## [37] "retweet_statuses_count"
3. Data preprocessing
In the step of data preprocessing, I will construct the binary response variable, the user-specific predictors and the tweet-specific predictors from the previously selected 37 features. After the feature engineering, there are 19 variables in total for the model fitting.
3.1 Construct the binary outcome variable
The question of interest is to predict the Twitter users’ engagement with the posted tweet, so we need to first define engagement and explain how to quantify it. According to the Twitter help center, engagement means the number of times users interacted with a tweet, including retweets, replies, follows, likes, links, cards, hashtags, embedded media, username, profile photo, or Tweet expansion. Here in the report, I use a different and simplified definition for engagement.
I first define the engagement rate:
$$
engage\_rate = \frac{1}{2}(\frac{favoriate\_count + retweet\_count}{followers\_count}+\frac{favoriate\_count + retweet\_count}{statuses\_count})
$$
where favoriate_count and retweet_count are the number of favorites
and retweets received by the tweet, and followers_count and
statuses_count are the tweet user’s followers number and the total
number of tweets that the user has posted. In principle,
the rate takes into account the average interaction gives out by each
follower and the average interaction received by each tweet. Using this
equation, I then calculate the engagement rates for all tweets posted by
the politicians in the year 2021 and assign the 75% percentile as a threshold engage_thresh. Next I define the
binary variable engage_active, which has value 1 if the tweet’s
engagement rate is above the engage_thresh, otherwise it’s 0.
engage_active=1 indicates that the tweet has active engagement.
$$ engage\_active = ifelse(engage\_rate > engage\_thresh, 1, 0). $$
3.2 Construct the user-specific predictors
The information about a tweet comes from two parts, (1) the general information of the tweet such as users’ data, and (2) the text information of the tweet such the emotions. In this step, I construct 10 variables with regard to the tweet’s general information.
-
party (categorical): which party (Independent, Republican, Democratic) the politician belongs to. I web-scraped the social media accounts of the politicians from the public website, then assign the party information to each user. -
favor_perFriend (numerical): average number of favorites given by the user to the friends (people followed by the user). -
listed_level (numerical): if the number of organizations the user belongs to is less than the 0.25-th percentile of the number among all users, thelisted_level = 1. If the number is less than the 0.50-th percentile, thelisted_level = 2. If the number is less than the 0.75-th percentile, thelisted_level = 3. If the number is greater than the 0.75-th percentile, thelisted_level = 4. -
has_url (binary): whether or not url is included in the tweet. -
has_media (binary): whether or not media (photo) is included in the tweet. -
is_independent (binary): if the tweet is not quoted or retweeted or a reply, it’s an independent tweet, otherwise it’s not independent. -
engageQuoted_active (binary): the engage activity of the quoted tweet. same definition as theengage_active. -
engageRetweet_active (binary): the engage activity of the retweeted tweet. same definition as theengage_active. -
hashtag_num (numeric): the number of hashtag in the tweet. -
metion_num (numeric): the number of mentioned names in the tweet.
3.3 Construct the emotion-specific predictors
Each tweet text is first cleaned by removing the emojis, urls, punctuations, extra white spaces and numbers. Then the cleaned text is tokenized into words and from which common stop words (e.g. is, and) are removed. Then I use the NRC word-emotion association lexicon to classify each word into different emotions. Last the number of words of each emotion in a tweet is calculated and divided by the length of the cleaned tweet text.
-
textLength (numeric): length of the cleaned tweet text. -
anticipation (numeric): average number of words belong to anticipation in a tweet. -
anger (numeric): average number of words belong to anger in a tweet. -
fear (numeric): average number of words belong to fear in a tweet. -
negative (numeric): average number of words belong to negative in a tweet. -
joy (numeric): average number of words belong to joy in a tweet. -
positive (numeric): average number of words belong to positive in a tweet. -
trust (numeric): average number of words belong to trust in a tweet. -
sadness (numeric): average number of words belong to sadness in a tweet. -
surprise (numeric): average number of words belong to surprise in a tweet. -
disgust (numeric): average number of words belong to disgust in a tweet.
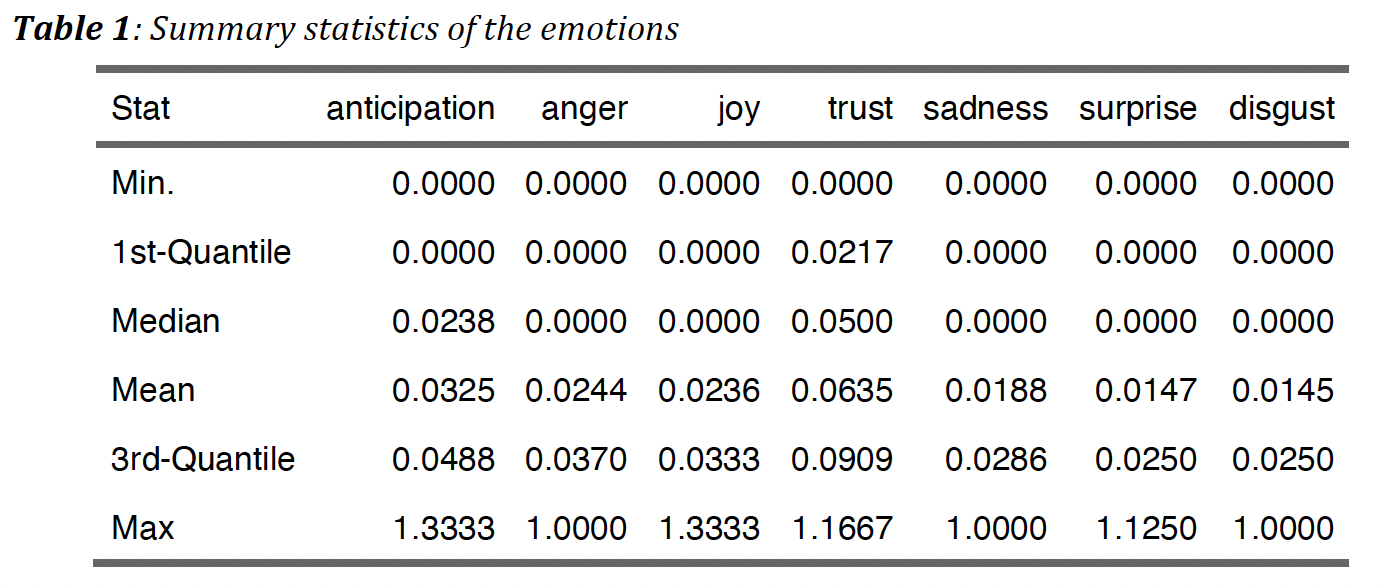
As we can observe from the summary statistics of each emotions, their distribution are approximately in the same range.
3.4 Check collinearity
Collinearity between variables can adversely affect the model
performance and gives inaccurate model inference. Therefore,
collinearity needs to be checked before we proceed to the model fitting.
So far, there are 22 variables constructed from the original tweet
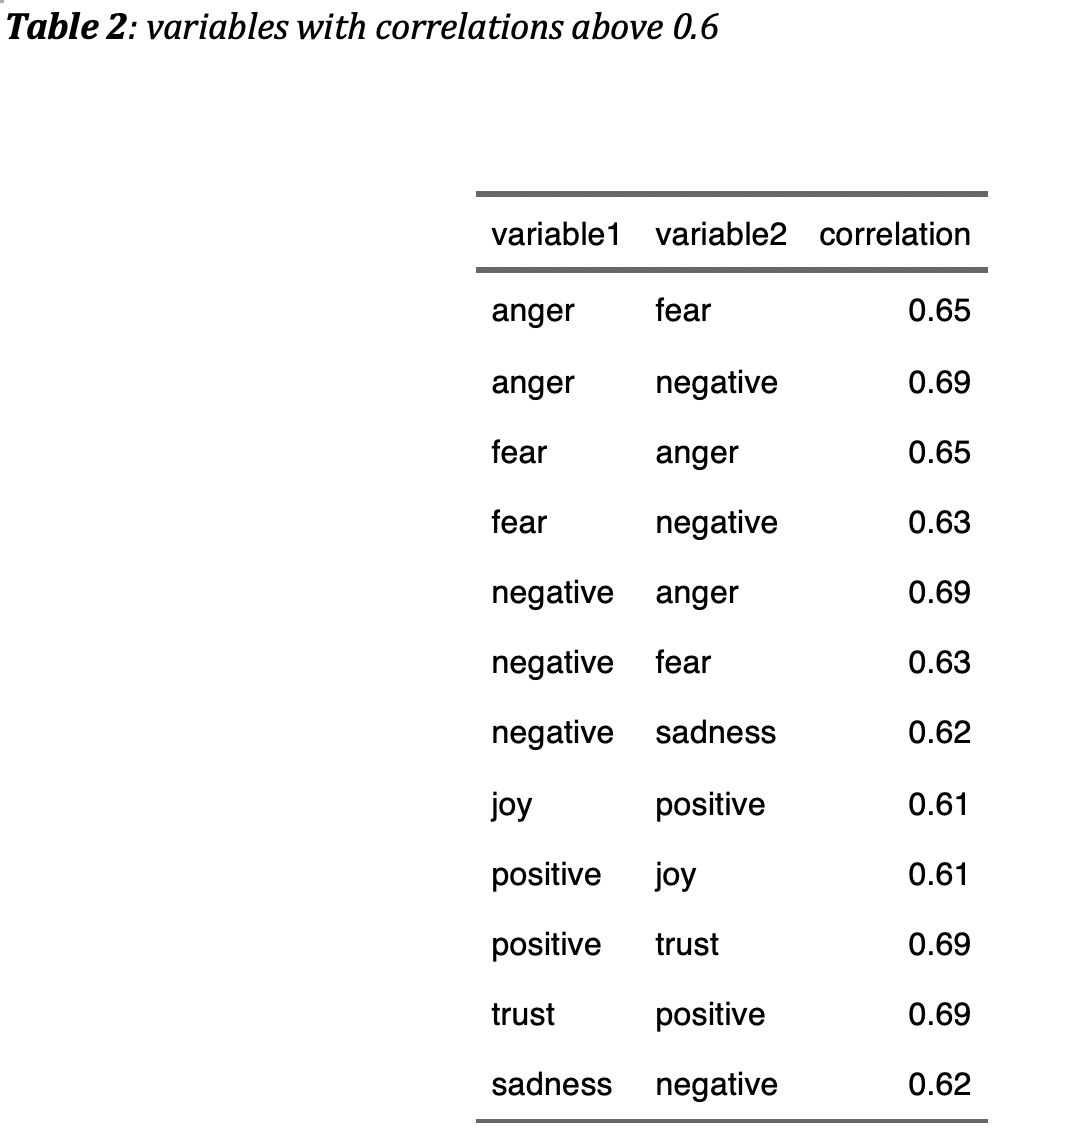
features. Table2 shows that variables anger, fear, sadness,
negative have high correlations, and joy, trust, positive have
high correlations. Therefore, I will remove variables negative,
positve and fear from the features, which leaves us with 19
variables in total.
4. Model selection and validation
In the final data set for analysis, a total of 19 variables (including the outcome variable) and 39396 observations are used. A set of logistic regression models are fitted to investigate the contributions of different emotions to the probability of tweets engagement.
4.1 Logistic linear regression model
logistic linear regression model formula:
## engage_active ~ engageQuoted_active + engageRetweet_active +
##     listed_level + has_url + has_media + favor_perFriend + is_independent +
##     hashtag_num + mention_num + tweetLength + anticipation +
##     anger + joy + trust + sadness + surprise + disgust + party
coefficients and their statistical significance
##                         Estimate   Std. Error    z value      Pr(>|z|)
## (Intercept)          -0.49382282 0.2486953127  -1.985654  4.707177e-02
## engageQuoted_active   1.72635071 0.0515182286  33.509512 3.503348e-246
## engageRetweet_active  2.00180117 0.0463944850  43.147395  0.000000e+00
## listed_level          0.25671865 0.0105031368  24.442094 6.107356e-132
## has_url              -0.81545148 0.0297534594 -27.406947 2.266545e-165
## has_media            -0.06319078 0.0321895617  -1.963083  4.963654e-02
## favor_perFriend       0.04396242 0.0033338353  13.186741  1.046112e-39
## is_independent        1.27972422 0.0325541788  39.310597  0.000000e+00
## hashtag_num          -0.54845968 0.0227785136 -24.077940 4.256689e-128
## mention_num          -0.36422112 0.0155223176 -23.464352 9.434741e-122
## tweetLength          -0.00501781 0.0009981709  -5.027005  4.982005e-07
## anticipation         -0.45298965 0.3073598323  -1.473809  1.405331e-01
## anger                 5.06003872 0.3958123541  12.783933  2.016101e-37
## joy                  -2.45194829 0.3673852845  -6.674051  2.488363e-11
## trust                 1.02832282 0.2114286154   4.863688  1.152185e-06
## sadness              -1.21352269 0.4251585945  -2.854282  4.313417e-03
## surprise              2.80585466 0.4490070466   6.249021  4.130322e-10
## disgust               1.51901168 0.4745828245   3.200730  1.370797e-03
## partyR               -1.01209614 0.2419078728  -4.183808  2.866660e-05
## partyD               -1.19645240 0.2413941957  -4.956426  7.180181e-07
4.2 Contributions of different emotions
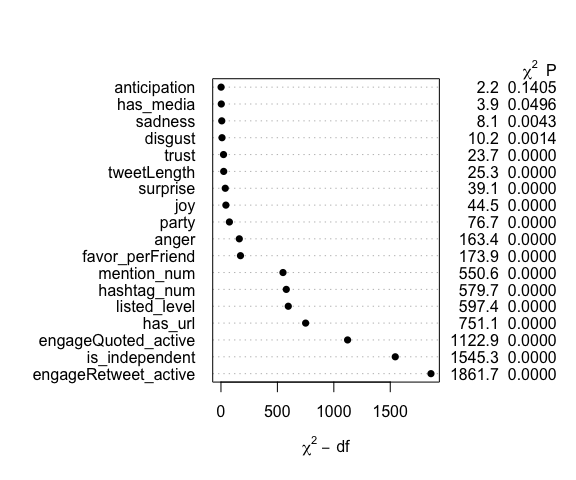
The test statistics from ANOVA are applied to compare the relative contributions of predictors to the probability of tweets engagement. The figure below shows that the dependent information of retweeted and quoted tweets make the most contribution the outcome probability. Among all the 7 emotions being investigated, the anger contributes more than other emotions, and joy is the second largest. In the following analysis, I will focus on the two emotions: anger and joy.
4.3 logistic spline model
Though from last step it shows that anger and joy are statistically significant, but they may have a non-linear relation with the probability of tweets engagement. Here I fit a logistic spline model and apply natural cubic spline with 5 knots on variables anger and joy respectively. The ANOVA test shows that the non-linearity of anger and joy has statistical significance.
Spline model formula.
## engage_active ~ (engageQuoted_active + engageRetweet_active +
##     listed_level + has_url + has_media + favor_perFriend + is_independent +
##     hashtag_num + mention_num + tweetLength + anticipation +
##     anger + joy + trust + sadness + surprise + disgust + party) -
##     anger - joy + ns(anger, 5) + ns(joy, 5)
ANOVA test has P-value 1-pchisq(97.619, 4) = 0 less than 0.05, which
indicates the statistical significance of non-linearity of anger and
joy.
4.4 logistic spline with interaction between party and emotions
It’s an interesting question to ask that if emotions anger and joy make different contributions when taking into account the politicians’ party. Here I fit a spline model with interaction terms between anger and party, and joy and party. The ANOVA test shows that the interaction terms have statistical significance.
Spline model with interaction formula.
## engage_active ~ (engageQuoted_active + engageRetweet_active +
##     listed_level + has_url + has_media + favor_perFriend + is_independent +
##     hashtag_num + mention_num + tweetLength + anticipation +
##     anger + joy + trust + sadness + surprise + disgust + party) -
##     anger - joy + party * ns(anger, 5) + party * ns(joy, 5)
ANOVA test has P-value 1-pchisq(25.86, 13) = 0.018 less than 0.05,
which indicates the statistical significance of interaction between of
emotions and party.
4.5 Relation between emotions and the outcome probability
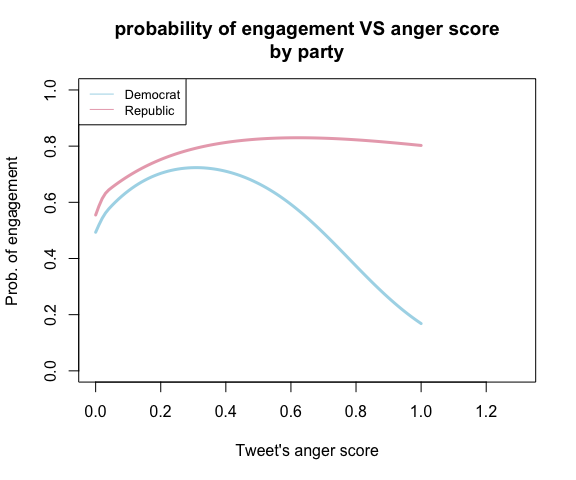
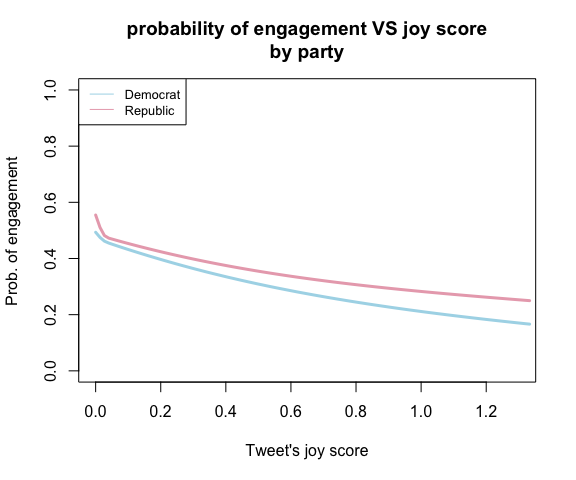
Since emotions have a non-linear relation with the engagement probability, we can visualize the relation. It’s interesting to observe from the plots that there seems exist an anger threshold, before the threshold, the more angry the tweet, the more likely the tweet gets active engagement. However, after the tweet’s anger reaches the threshold, the more extreme emotion makes people less engaged with democrat’s tweets, but keep engaged with republican’s tweets at the same level. As for the emotion joy, the plot shows that the more joyful the tweet, the less likely it gets active engagement. In addition, the plots give the information that people are more likely to engage with angry tweets than joyful tweets.
5. Results interpretation
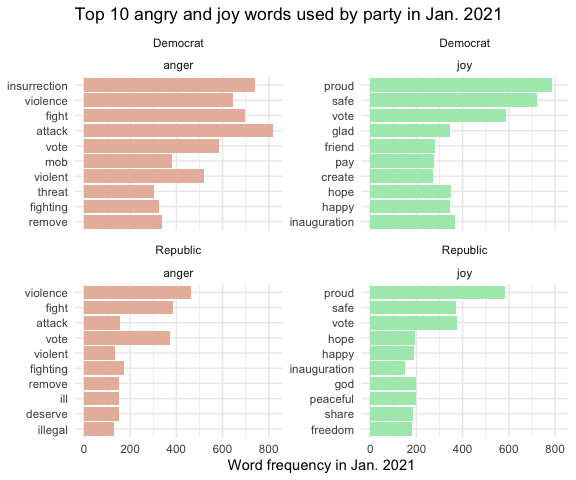
5.1 Top 10 anger and joy words used in the tweets
From section 4 we have made the conclusion that the emotion anger makes people more likely to engage with the tweet than joy and other emotions. Now the question of interest is what the tweets are talking about, and what makes the tweet angry or joyful? I investigate the top 10 angry and joyful words used by republican and democratic politicians in the tweets in Jan. 2021. It shows that democratic tweets use more angry and joyful words than the republican tweets. Recalling the news back at Jan. 2021, the most anger-triggered event was the capitol attack. And the Word frequency plot shows that politicians from both parties are angry about the event, but their tones or narratives are a bit different. Democrats used the angry words like “insurrection” and “mob”, while those words didn’t not appear in republican’s tweets as much often. As for the joyful events, the inauguration was what politicians mentioned most in Jan. 2021.
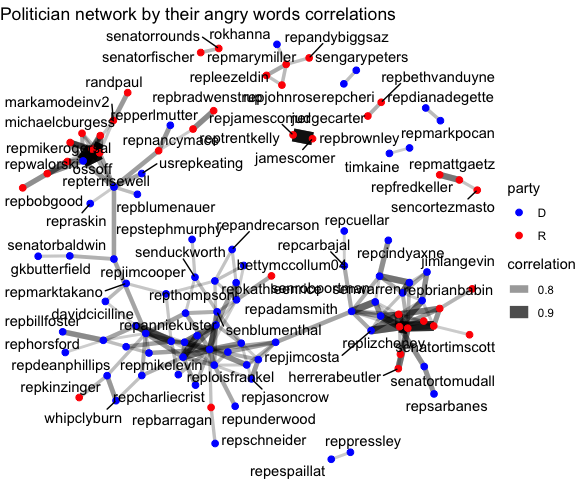
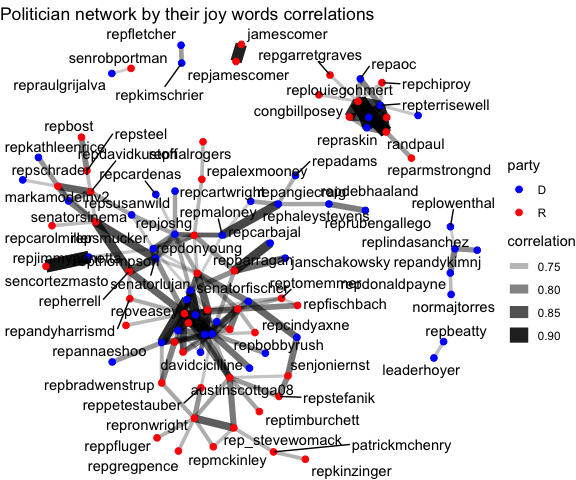
5.2 Network plots of politicians based on angry and joyful tweets
We know that politicians from different parties usually have different opinions. But are they also divisive facing the events that make both of them angry or happy at the same time? In this section, I made network plots of the politicians based on their correlations in terms of the angry words and joyful words used in the tweets. As can be observed from the network plots, the democrats and republicans are very divisive when it comes to the tweets content that invokes angry feelings, as we can see that the nodes of same color are more likely clustered together. Nevertheless, the two parties are less divisive when tweeting contents that has joyful attitudes, as the nodes of different colors tend to be clustered together, but still the correlation between nodes of different colors are weaker than the correlations between nodes of the same color.
6. Discussion and next steps
In this report, I have investigated both quantitatively and qualitatively, how the emotions, especially anger and joy, are affecting people’s engagement with politicians’ tweets from different parties. The major conclusion is that angry tweets make people more likely to engage with it than other emotions. However, should we encourage politicians to use more anger words in their tweets to get engagement? Personally, I think the answer depends on two things. Firstly, the conclusion needs to be further examined before adopt it in practice. Due to the fact that in Jan. 2021, the whole nation was in shock of the capitol attack, it’s possible that people could experience more extreme emotions than usual, which prompted them to engagement more with the politicians’ tweets. Therefore, the conclusion needs to be further verified on tweets collected at other time periods. Secondly, though it’s encouraged to express negative feelings for the sake of mental health, in the context of politicians using the emotions as a tool to attract attention and engagement, we need to be very careful. Anger sometimes can trigger aggression and hostility, which should be alerted and constrained. Additionally, the report is focusing on interpreting the effects of certain predictors on the outcome, it does not investigate the predictive accuracy of the fitted models, which can be expanded in the future if model’s predictive ability is of interest.