
Statistical analysis learnt from vaccine studies
Ever since the first covid-19 vaccine1 came out last year and got emergency use approval by FDA, as a statistician, I always felt prompted to learn how the statistical analysis was conducted in the study and helped draw such an important conclusion. Meanwhile, for the past few months, I have been assisting in making statistical analysis plan (SAP)2 for a multi-center population-based study and acquired a basic sense about the whole plan-making process, so I think now might be a good timing to review the SAP3 of the vaccine study, record and share the ideas and methodologies that I have learnt from it.
In this post, I mainly focus on summarizing and categorizing the statistical analysis methods employed in the SAP, one can check the official protocol3 for more details on study design/population/procedure/assessment if interested. The technique details of those statistical methods are not discussed here, since one can always find plenty of resources by searching the keywords online.
Figure 14 is a mind-map that summarizes the statistical methods serving different analysis purposes. Roughly speaking, there are two major tasks: 1) evaluate if the adverse reactions to the vaccine are safe and align with expectations; 2) evaluate if the vaccine efficacy meets the success criterion. If both tasks are achieved, then the vaccine can be declared efficacious. The statistical methods consist of both summary statistics/plots and modeling inferences. You can click the figure to zoom in and check the details, for example, the analysis methods used to deal with binary, continuous and missing data.
Personally, I think the most intriguing and important method among all is the Bayesian approach of using beta-binomial model to calculate the posterior probability and credible interval of the vaccine efficacy (highlighted in blue), one can refer to this post5 for calculation details. It’s a terrific example of using Bayesian approach in practice, I wish I had this example in my Bayesian class years ago, so I could have a better understanding of Bayesian method.
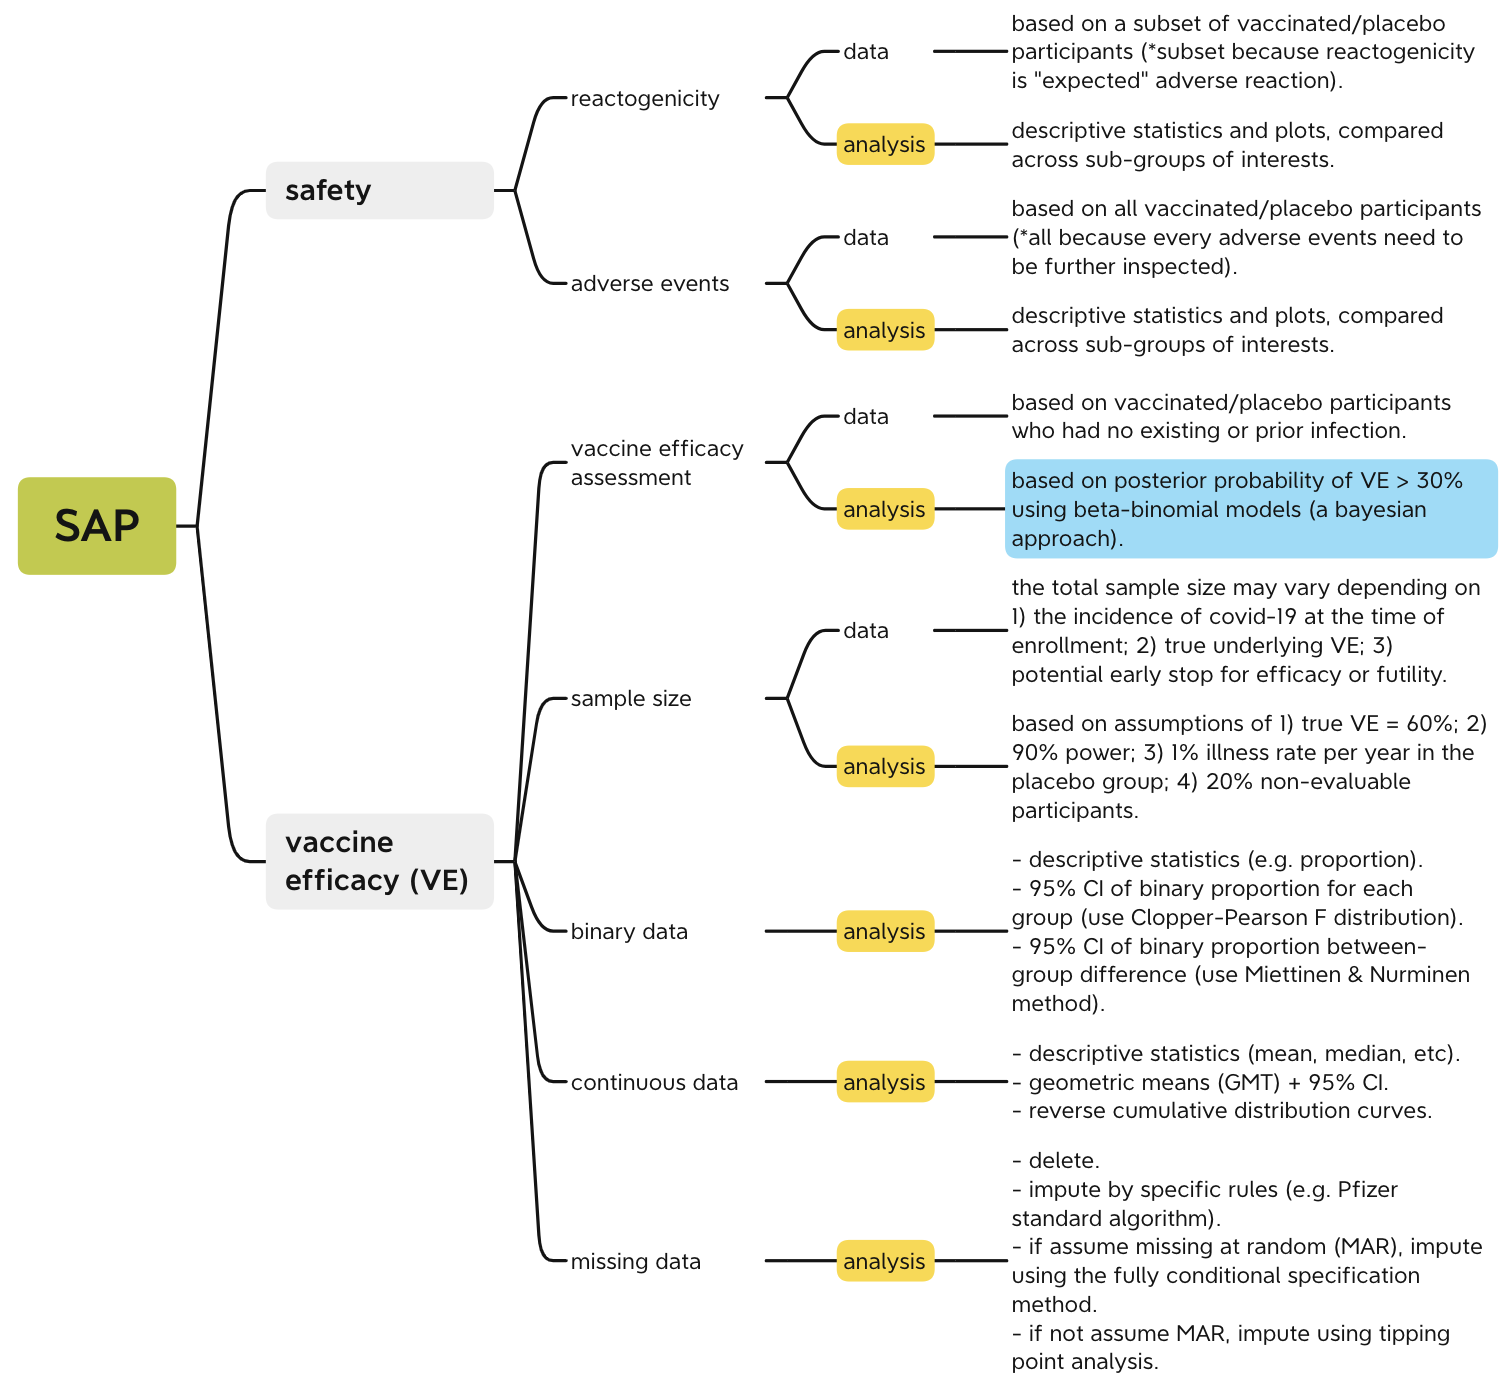
Figure 1: mind-map of the statistical analysis plan (click to zoom in)
Statistics is a subject studying the uncertainties. It helps you make decisions by telling you what’s the likelihoods of being wrong, so you take the one that’s less likely being wrong. With that in mind, the statistical analysis plan in the vaccine study or any study is a great demonstration on how you can maneuver the uncertainties and make a reliable decision. However, a trustworthy statistical result is also conditional on having solid study design and data of integrity, which is beyond the scope of the post. Besides the statistical methodologies, another lesson I learnt is that training in qualitative analysis/context is no less important. It may seem like the final decision is a product of quantitative analysis, but actually there are lots of qualitative judgements involved along the way, and I realized it more when I worked for a research project with other epidemiologists and doctors, their expertise always helped guide the research on the right direction, which I still have a lot to learn from and improve on.
-
Safety and Efficacy of the BNT162b2 mRNA Covid-19 Vaccine ↩︎
-
Statistical analysis plan (SAP) describes the planned analysis of clinical trials, and is a technical document detailing the statistical techniques and potential outputs of research analysis. ↩︎
-
BNT162b2 mRNA Covid-19 Vaccine Statistic Analysis Plan ↩︎ ↩︎